Typical Steam Cycle Thermodynamics - Thermodynamics
Thermodynamics Directory | Heat Transfer Directory
Typical Steam Cycle Thermodynamics
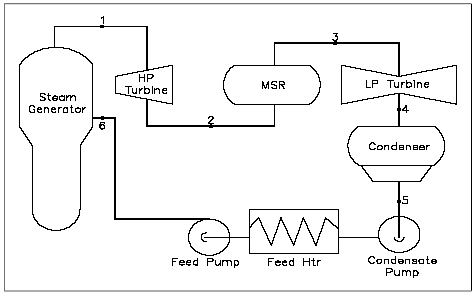
Figure 35 shows a simplified version of the major components of a typical steam plant cycle. This is a simplified version and does not contain the exact detail that may be found at most power plants. However, for the purpose of understanding the basic operation of a power cycle, further detail is not necessary. The following are the processes that comprise the cycle:
1-2: Saturated steam from the steam generator is expanded in the high pressure (HP) turbine to provide shaft work out put at a constant entropy.
2-3: The moist steam from the exit of the HP turbine is dried and superheated in the moisture separator reheater(MSR).
3-4: Super heated steam from the MSR is expanded in the low pressure (LP) turbine to provide shaft work output at a constant entropy.
4-5: Steam exhaust from the turbine is condensed in the condenser in which heat is transferred to the cooling water under a constant vacuum condition.
5-6: The feed water is compressed as a liquid by the condensate and feed water pump and the feed water is preheated by the feed water heaters.
6-1: Heat is added to the working fluid in the steam generator under a constant pressure condition.
Figure 35
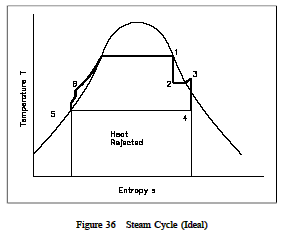
The previous cycle can also be represented on a T-s diagram as was done with the ideal Carnot and Rankine cycles. This is shown in Figure 36. The numbered points on the cycle correspond to the numbered points on Figure 36. It must be pointed out that the cycle we have just shown is an ideal cycle and does not exactly represent the actual processes in the plant. The turbine and pumps in an ideal cycle are ideal pumps and turbines and therefore do not exhibit an increase in entropy across them. Real pumps and turbines would exhibit an entropy increase across them.

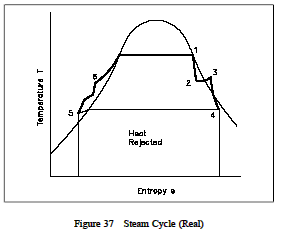
Figure 37 is a T-s diagram of a cycle which more closely approximates actual plant processes. The pumps and turbines in this cycle more closely approximate real pumps and turbines and thus exhibit an entropy increase across them. Additionally, in this cycle, a small degree of subcooling is evident in the condenser as shown by the small dip down to point 5. This small amount of subcooling will decrease cycle efficiency since additional heath as been removed from the cycle to the cooling water as heat rejeced. This additional heat rejected must then be made up for in the steam generator. Therefore, it can be seen that excessive condenser subcooling will decrease cycle efficiency. By controlling the temperature or flow rate of the cooling water to the condenser, the operator can directly effect the overall cycle efficiency.

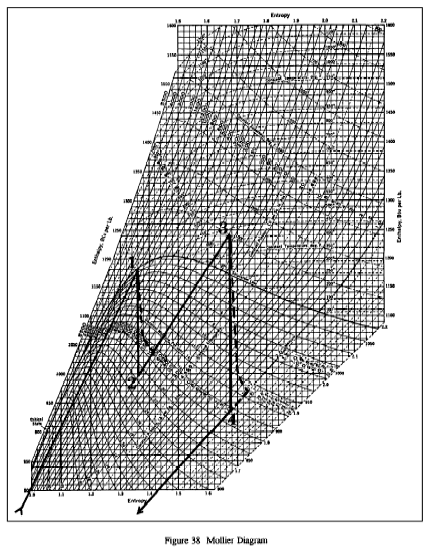
It is sometimes useful to plot on the Mollier diagram the processes that occur during the cycle. This is done on Figure 38. The numbered points on Figure 38 correspond to the numbered points on Figures 35 and 36. Because the Mollier diagram is a plot of the conditions existing for water in vapor form, the portions of the plot which fall into the region of liquid water do not show up on the Mollier diagram. The following conditions were used in plotting the curves on Figure 38.
| Point 1: | Saturated steam at 540oF |
| Point 2: | 82.5% quality at exit of HP turbine |
| Point 3: | Temperature of superheated steam is 440oF |
| Point 4: | Condenser vacuum is 1 psia |
The solid lines on Figure 38 represent the conditions for a cycle which uses ideal turbines as verified by the fact that no entropy change is shown across the turbines. The dotted lines on Figure 38 represent the path taken if real turbines were considered, in which case an increase in entropy is evident.
Causes of Inefficiency
In the preceeding sections, cycle and component efficiencies have been discussed, but the actual causes or reasons for the inefficiencies have not been explained. In this section we will compare some of the types and causes for the inefficiencies of real components and cycles to that of their "ideal" counterparts.
Components
In real systems, a percentage of the overall cycle inefficiency is due to the losses by the individual components. Turbines, pumps, and compressors all behave non-ideally due to heat losses, friction and windage losses. All of these losses contribute to the non-isentropic behavior of real equipment. As explained previously (Figures 24, 25) these losses can be seen as an increase in the system’s entropy or amount of energy that is unavailable for use by the cycle.
CyclesIn real systems, a second source of inefficiencies is from the compromises made due to cost and other factors in the design and operation of the cycle. Examples of these types of losses are: In a large power generating station the condensers are designed to subcool the liquid by 8-10°F. This subcooling allows the condensate pumps to pump the water forward without cavitation. But, each degree of subcooling is energy that must be put back by reheating the water, and this heat (energy) does no useful work and therefore increases the inefficiency of the cycle. Another example of a loss due to a system’s design is heat loss to the environment, i.e. thin or poor insulation. Again this is energy lost to the system and therefore unavailable to do work. Friction is another real world loss, both resistance to fluid flow and mechanical friction in machines. All of these contribute to the system’s inefficiency.

